

 When teaching the format for writing Scientific Explanations, we complete one together for reference. We start with the claim and thinking about what we want to prove. Most of the time, the claim is directly related to the standard. Next, we complete a quick scientific investigation. I have the class do a lot of thinking on their own, partner talk, and whole group discussion. Most of the time we build on each others statements and try to put our words into “kid friendly/scientific” language. In the beginning, students copy down the information from the chart paper, each time I gradually take sections away leading students to complete independence in writing their explanations following this scaffolded frame. If you want to test this out in your classroom, check out my new product up on TPT. I've been working on it for weeks and wanted to test out everything in my classroom before putting it up for sale. It will have specific instructions for writing scientific explanations as well as four different labs that are easy, engaging, meaningful, and fun! It has been a life saver for my team and I and I am finally feeling confident, planned, and knowledgeable while teaching Science.
When students record their data on a chart, I like to give them the opportunity to create a graph. It is a huge help for some students, especially my visual learners! Sometimes we even graph whole class data. Students love this opportunity because they can see how they compare to other students who preformed the investigation. Of course we then discuss that Science is not a competition and go back to the actually meaning of the investigation.


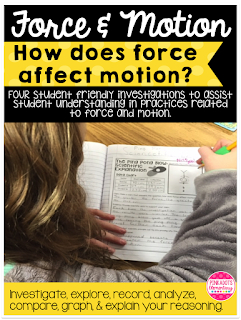
When students take their time to explain evidence, I want them to look at their data, make sense of it, and explain it…clearly. Taking the fluff out of scientific writing is a struggle with not only my students, but also myself, but we’ve been getting better. This is a sample of a student’s evidence section from the “Box Push.”

I was thrilled with response. The only thing that would have made this better was putting actual numbers in the answer from the data chart. Even so, this was a huge step for this group of fourth graders. #soproud
Come back tomorrow to read about using scientific principles in an explanation and also to see how to get students familiar and testing the principles.

No comments:
Post a Comment
We absolutely LOVE comments and reply back to every single one. Unfortunately, the way the site is set up, you will not be notified when we reply. Make sure you have your email address linked up to your account. We will reply to you by email! Thank you SO much for stopping by and reading what we have to say.